

Performance monitoring in the intranet: Creating value in 2026

The most popular advice on performance monitoring is also the most misleading. Far too many people still associate it with control, measuring individuals and a digital look over the shoulder. In practice, this approach quickly creates resistance, low trust and poor data.
In a modern intranet, performance monitoring only provides real value when it is used to improve communication, access to knowledge and workflows. It is not about measuring who clicks the most. It is about seeing whether employees can find procedures, whether critical messages are read in time, and whether the organisation spends unnecessary time searching for answers.
This is particularly important in complex organisations with shift work, multiple locations, high documentation requirements and many employees without a fixed PC. Here, poor access to information is not just an annoyance. It is an operational challenge.
Performance monitoring is not what you think
When managers hear the word performance monitoring, many still think of individual measurement. That is a false start. In intranet-related work, monitoring provides the most value when it shows whether the organisation is functioning better as a whole.
In large, complex environments, the problem is rarely that an individual employee does too little. The problem is more often that essential knowledge is scattered, that procedures are hard to find, or that critical messages do not reach the right groups quickly enough. This is when performance monitoring becomes a tool to measure organisational friction.
This is also what the development looks like in practice. In Denmark, 94% of large public organisations have implemented performance monitoring, and 67% integrated an AI assistant in 2023. This reduced the search time for internal data by 45% and duplication of work by 38%, as described in Colibo's article on the development of performance monitoring. This points to a shift from control to efficiency.
Performance monitoring only makes sense when data helps employees find answers faster and complete tasks with fewer interruptions.
The important dividing line is therefore not between those who measure and those who do not. It is between organisations that use data to support work and organisations that use data to keep an eye on people.
When the focus shifts, the whole conversation changes. The question is no longer who read the least. The question becomes why the message was not relevant, visible or accessible to the target audience that needed it.
From control to insight into organisational health
A good intranet should do the same as good infrastructure. It must be stable, easy to use and fast to navigate. Performance monitoring should therefore be treated as diagnostics, not as control.
What is measured must be improvable
When organisations measure correctly, data becomes a form of operational picture. Not of individuals, but of the system. Patterns can be seen in where information stops, which teams lack access to knowledge, and which processes create unnecessary searching, questions and detours.
This mindset resembles technical troubleshooting. Instead of assuming everything is working, heat generation, load and anomalies are measured to detect problems before they develop. This logic is also known from professional thermography from OAD El-teknik, where hidden faults are identified by reading patterns in an installation. On the intranet, it is not electrical panels, but communication, searching and content usage that reveal the hidden problems.
A useful dashboard must therefore be able to answer questions like these:
Do employees find answers themselves or do they still go via management, HR or IT?
Do critical messages reach the relevant groups in time?
Do operational teams use mobile devices in the way the platform intends?
Are procedures found quickly, or does search data reveal a structural problem?
Think like an operations technician, not a controller
The old approach measures behaviour. The modern approach measures working conditions. This is the difference between asking if people are doing the right thing and asking if the system makes it easy to do the right thing.
A simple comparison makes the difference clear:
Approach | Typical question | Consequence |
|---|---|---|
Control | Who has not read the message? | Risk of resistance and mistrust |
Diagnostics | Why did the message not get through? | Better content, timing and targeting |
Surveillance | Who searches most often? | Narrow and person-focused interpretation |
Organisational insight | What information is hard to find? | Improved structure and fewer interruptions |
Practical rule: If a measurement point cannot be translated into a concrete improvement in content, navigation, search or workflow, it is rarely a good KPI for the intranet.
It is therefore useful to let communications, HR, operations and local managers look at the same patterns. When multiple functions share the same picture of the organisation's digital everyday life, it becomes easier to prioritise the changes that actually reduce friction.
The 9 most important KPIs for organisational impact
The best KPIs in an intranet do not measure individual performance. They measure whether the platform helps the organisation work better. This requires different questions and different dashboards.
KPIs that show if the platform is being used correctly
1. Active users
This KPI shows whether the intranet has become a natural part of the workday. In Danish public organisations, typical active usage lies at 65-75%, and over 40 municipalities use it as a primary KPI, according to Workvivo's review of intranet KPIs. A high level is not an end in itself. It is a sign that the platform is actually integrated into the work.
2. Read rates on important messages
Operational updates, HR information, safety messages and leadership communications must not just be published. They must be read by the right audiences. A low read rate rarely means a lack of will. It often means that the content is poorly targeted, poorly timed or poorly packaged.
3. Time to first view
For time-sensitive messages, speed is more important than overall reach. If the relevant employees open the message too late, the communication is practically a failure, even if many see it later.
A strong communication model requires classic KPIs to be linked to actual behavior. This line of thought is close to working with good internal communication in complex organisations, where timing, relevance and targeting matter more than just volume.
KPIs that reveal friction in everyday life
4. Mobile usage
Mobile behavior is crucial when many employees are on the move, in operations or working without a fixed workstation. If mobile usage is low in target audiences that should be mobile-first, there is often a problem with user experience, notifications or the relevance of the content.
5. Searches and document views
This is often the most undervalued source of data. Search behavior reveals where employees experience uncertainty, lack of overview or too many clicks. If the same procedure is searched for again and again, it is rarely just a sign of high interest. It is a sign of friction.
6. Fewer repetitive questions
This KPI is often measured indirectly. If managers, HR, IT or operations receive fewer repetitive questions about something that is already on the intranet, it is a strong sign that the platform is making employees more self-sufficient.
When searches, document views and questions point in the same direction, the problem is usually not the users. It is the information design.
A brief overview makes it easier to choose the right actions:
KPI | What it reveals | Typical action |
|---|---|---|
Mobile usage | Poor access for employees on the move | Shorter formats, better notifications |
Searches | Information gaps or weak structure | Quick links, better metadata, more visible procedures |
Repetitive questions | Low self-service | Clearer homepages and better content ownership |
KPIs that support compliance and operations
7. Content engagement
Likes, comments, feedback, group participation and responses to posts show whether the intranet is only used for one-way information or whether it also supports dialogue. This KPI should be read with care. High activity is not always good, and low activity is not always bad. On some content types, quick understanding is more important than debate.
8. Completion of mandatory reading content
For policies, safety instructions, onboarding and work environment, it is useful to be able to monitor whether relevant groups have seen and confirmed the information. Here, performance monitoring is about documentable compliance and less risk of important information slipping into local interpretations.
9. Content freshness
Outdated pages almost always create double work. Therefore, organisations should measure whether pages and documents are updated on time and whether there are clear owners of the content. This is not a glamorous KPI, but it has a big impact on credibility and utility value.
A mature setup does not use all nine KPIs with the same weight. A municipality with many administrative employees will emphasise read rates, search and content freshness. A hospital or operational organisation will typically have a greater focus on mobile behavior, time to first view and mandatory reading content.
How to use data to motivate rather than demotivate
Data can quickly lose its value if employees perceive it as a tool of control. This is especially true in the public sector and other environments with high sensitivity around personal data, work environment and trust.
Therefore, performance monitoring must be designed with a clear principle. Data must be used for learning and improvement. Not for singling out individuals. This is not only a cultural issue, but also a legal and ethical one. Ugeskriftet's article on electronic performance monitoring points to the legal and ethical risks, and without clear guidelines, organisations can create a surveillance environment and run into conflict with GDPR.
Data must be shown at the right level
The safest and most useful starting point is at team, department or organisation level. Here, data becomes usable without being focused on individuals. A manager can see that a group of employees has not seen an important message, but the dashboard should lead to the question: What in the communication or access didn't work?
This also changes the tone of working with dashboards. Leaderboards of individuals create defensiveness. Team views create dialogue about workflows, content and support needs.
In practice, these steps work well:
Show patterns rather than names so that data points towards collective improvements.
Use anomalies as the start of a question instead of the end of an assessment.
Link every data point to an action such as retargeting, a better homepage or local introduction.
Dashboards must lead to help, not exposure
When a read rate is low on a safety update, the conclusion should not be that people are not paying attention. The correct conclusion might be that the message should have been shorter, more mobile-friendly, more local or more clearly linked to the work task.
Employees accept data when they can see that data is being used to make their workday easier.
It is also wise to share positive results. When a team gains easier access to procedures, when mobile use improves, or when the number of repetitive questions drops, this should be highlighted as progress. This reinforces the experience that measurement is used for support.
The most important leadership task is therefore not to get more dashboards. It is to ensure that every view of data points towards help, prioritisation and improvement.
From data to action with real-time dashboards
The clearest proof of good performance monitoring does not come from reporting. It comes from the changes the organisation manages to make before a problem becomes entrenched.

When the dashboard revealed the real problem
In one intranet project, the launch initially looked strong. News had many views, and several employees logged in. If the organisation had only looked at overall numbers, the conclusion would have been that everything was going well.
The real-time dashboard showed something else. Engagement was high among office employees, but significantly lower among employees in operations and on the move. The crucial problem was not general adoption. It was unbalanced adoption.
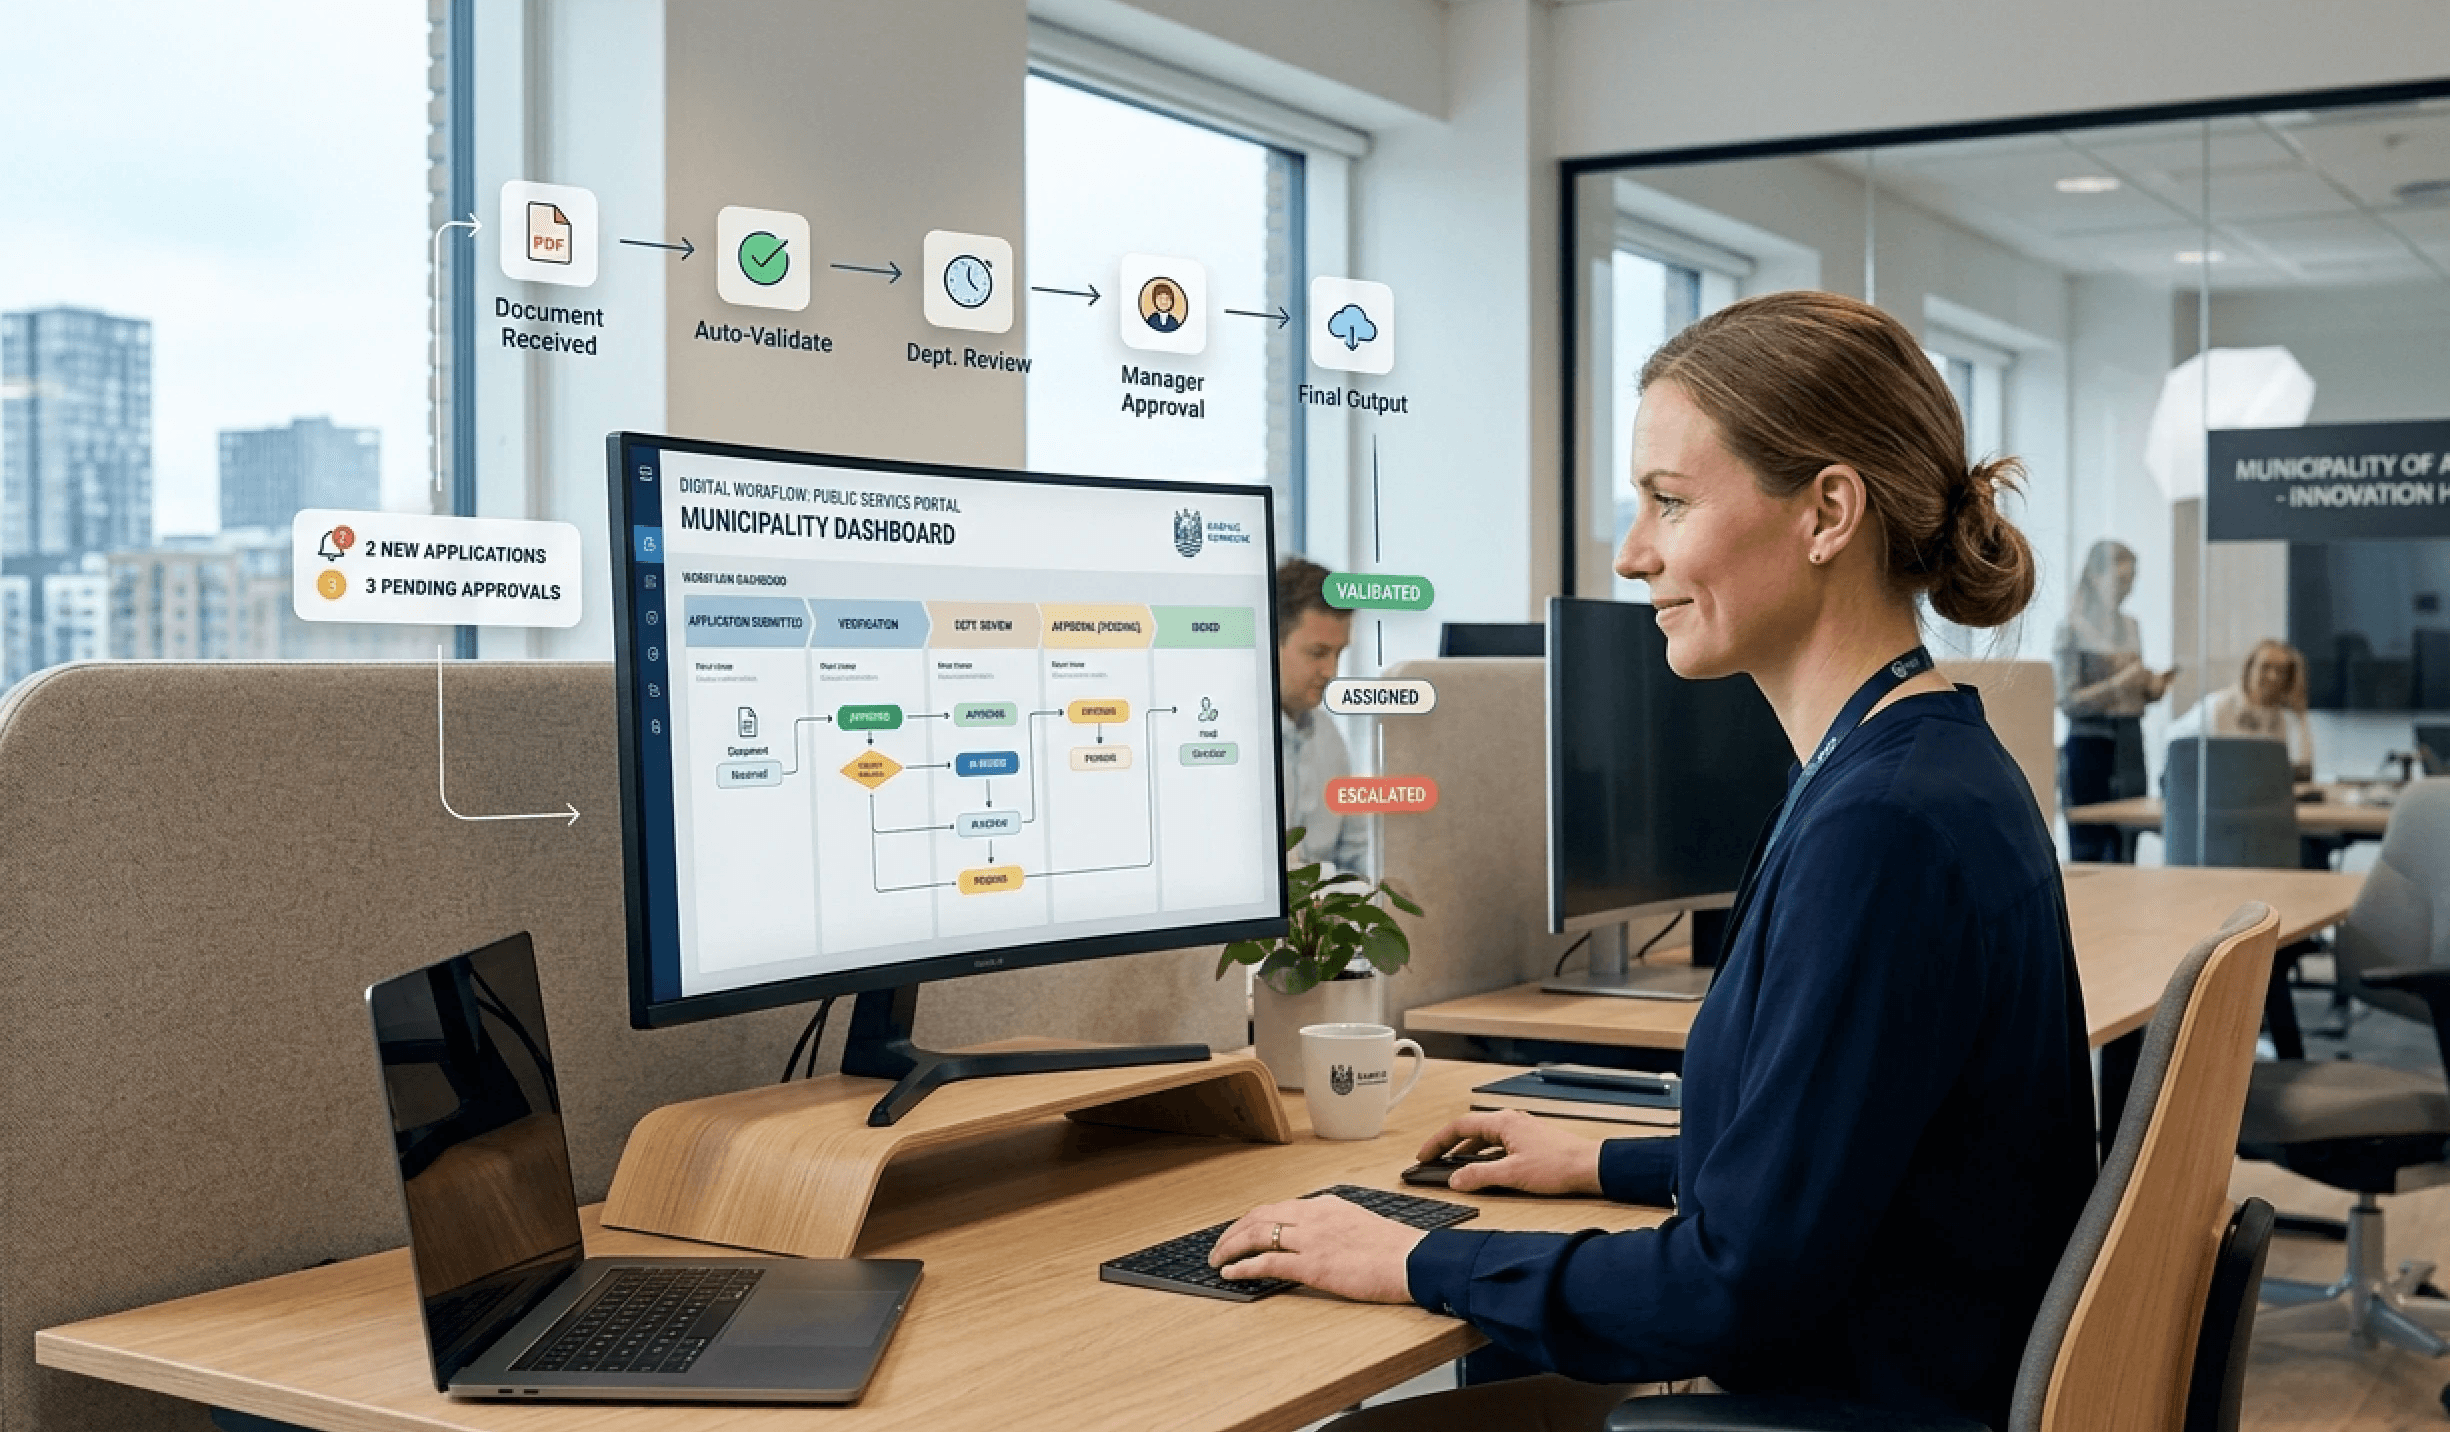
The most important messages were not being opened by certain target groups, especially employees without a fixed PC. The dashboard thus revealed an implementation problem that a monthly status report would likely have hidden.
The adjustments that changed adoption
The approach was quickly changed. Not with more general news, but with more precise support. The organisation adjusted in three areas:
Targeting by role and location so that messages became more relevant.
Mobile notifications for the most important updates for employees without a fixed PC.
A more operationally focused homepage with quick links to procedures, shift information and local news.
At the same time, local leaders and ambassadors were actively involved in shift handovers and team meetings. This made the intranet tangible. The platform was presented not as a communications project, but as a working tool.
After the adjustment, the dashboard showed that more people in operations began to open messages, use mobile devices and access the documents relevant to their role. The most important lesson was simple. Real-time dashboards are not just for reporting. They make it possible to manage implementation continuously based on actual behavior. Organisations wanting to work with this type of adjustment should choose a platform with strong analytics and targeting capabilities, as described in the overview of intranet functions.
Choose the right tool with a focus on data sovereignty
A dashboard is only as useful as the platform it is built on. Many organisations still choose tools based on surface-level features. In practice, the choice should start somewhere else. Data access, integration freedom, hosting and dependency management often matter more in the long run.
What the platform must be able to do in practice
A good tool for performance monitoring in the intranet must be able to collect signals from multiple types of behavior. Not just views and clicks, but also search, document usage, mobile usage and target group access. Otherwise, monitoring becomes superficial.
At the same time, the platform must fit into the existing environment without technically locking the organisation in. Integration with Microsoft 365 and Google Workspace is useful, but technical dependency is another matter. It is worth understanding the difference, especially in public organisations and other environments with long contracts and high switching costs. This perspective is well described in the analysis of supplier dependency in the public sector.
A practical checklist typically looks like this:
Can the platform analyse search behavior and not just news consumption?
Can dashboards be adapted to different roles such as communication, HR, operations and management?
Can data be shown at team and department level without inviting individual surveillance?
Can mobile devices be properly supported for employees without a fixed PC?
Security is a design choice, not an add-on
In Denmark, data sovereignty is not a niche requirement. It is a central selection criterion. In 2020, 89% of Danish municipalities initiated a national strategy for digital performance monitoring with the goal of halving administrative time consumption by 2025, and by 2025, 91% of Danish hospitals and care organisations had automated monitoring with EU hosting to ensure data sovereignty, as described in the previously mentioned development in the area.
This means that tool selection must be assessed with the same seriousness as other critical operational choices. Hosting in the EU or Denmark, documented security work and clear governance around data are not things that can be layered on afterwards.
A tool for performance monitoring must be able to create insight and limit risk. If it can only do the first, it is not suitable for complex organisations.
The best setup is therefore rarely the flashiest. It is the setup that can be used securely, understood widely and improved continuously without creating new dependencies.
Getting started with meaningful performance monitoring
The biggest mistake is starting too big. Performance monitoring becomes most useful when the organisation begins with a few clear questions and only the KPIs that can be translated into action.
A good first step is to choose 2-3 KPIs that say something about the workday. For many organisations, active users, read rates on important messages and searches are a strong starting point. They quickly show whether the platform is being used, whether communication is getting through, and where employees encounter friction.
The next step is to agree on the rules of engagement before the dashboard goes live. Data should be shown at team, department or organisation level, and everyone involved should know what the numbers will be used for. When the purpose is clear, data becomes easier to accept and much easier to use correctly.
Finally, every KPI should be linked to a concrete reaction. A low read rate should trigger a change in format or targeting. Frequent repetitive searches should trigger better shortcuts or clearer content. Fewer repetitive questions should be registered as a gain, not just a data point.
Meaningful performance monitoring is therefore not about seeing more. It is about understanding more and improving more. When the intranet is measured as a working tool instead of a control system, data becomes a help for both management and employees.
Colibo helps complex organisations gather internal communication, knowledge sharing and daily work tools into one modern platform with a focus on user-friendliness, data sovereignty and organisational impact. See how Colibo can support an intranet where performance monitoring is used for improvement, not surveillance.